-
GOOGLE
Herald V1
NET NEW
Herald was a net-new initiative that addressed both Finance Analysts and business user needs for timely and accurate budget analysis and availability for >70k Google and Alphabet users.
ROLE
TIMELINE
Sr UX UI Designer
-
UX UI
-
Research
-
Content
-
Strategy
10 months
TEAM
-
Directors of Finance
-
FInance & Business Users (SME)
-
Engineering
-
Project Manager
-
Managers
FOCUS AREAS
-
Intuitive experiences
-
task simplification
-
contextual help reveal
-
adhere to style guides and modify when necessary

>70k
USERS
>90%
EFFICIENCY GAIN
98%
USER SATISFACTION
2 weeks to 3 sec
TIME TO TASK
Scroll to explore
- THE OVERALL PROBLEMS
Google and Alphabet Business and Finance (~70k active users) do not have a timely or accurate view into their budgets for them to be able to make informed key decisions on their budget availability.
-
7 app sources
-
2 weeks for response
-
stale data
-
mathematical errors
- THE OVERALL CHALLENGES
Resources
-
Engineering resources were limited and had other projects in the pipeline.
-
SMEs were short on time to review.
Process/User Evaluations
-
Users were extremely busy so interview/review strategy had to be concise
-
Evaluate 7 main tools/sources used to capture disparate financial dimensions
Communications
Ensure all Stakeholder Teams are in the loop.
- THE STRATEGY
Google and Alphabet Business and Finance (~70k active users) need an on-demand, customizable, view into their budgets in order to make immediate, accurate, and critical business decisions on spend within their organization and division, at a glance, removing the chance for over/under-spend which could delay payments and affect brand perception and payee base.
Create an accurate, on-demand, ground-up, foundational tool for both Budget and Finance (Ops), that allow for; immediate insights, customization, accountability, enabling immediate and accurate decision-making, and future spend planning.

- THE RESEARCH

Evaluate Eng POC
When I joined the team, Engineering had started
creating a simple data grid POC. I reviewed and started to get understanding and insights into the project.
Shown is a sample page from the readout deck.
I did a basic evaluation on the first 2 dimensions:
-
Usability
-
Accessibility
-
Design (high-level)

Evaluate the current process flow (before/after)
Main improvements (proven & evolving)
-
7 tools > 1 tool
-
No need for manual data aggregation
-
Direct API ingestion at data layer
-
Cross platform ACL implementation
Define users & tasks for MVP
Compiled from SME interviews.
Of the 7 identified users, we chose 4 main power users and prioritized the MVP tasks we would address.


Design Scrum
We conducted a day-long design scrum with our expanded Stakeholder Team.
The design scrum activities included:
-
user task identification
-
empathy analysis
-
pain point identification and categorization
-
flow definition
-
task and pain point prioritization, etc.

Analyze as-is flows and system interactions
Compiled from User interviews, these journeys were inefficient and very time-consuming for users.

Identify critical user journeys
-
Compiled from SME interviews.
Of the journeys identified we chose 1, 3, and 4 for MVP which address the critical aspects needed for our phase 1 users. I created mocks for all CUJs to be ready when MVP is released.


- THE FINAL PRODUCT (V1)
Below is a small part of the suite functionality.
-
Slim header allowing for more data display
-
Ability to switch currency and role in banner
-
On-call left nav drawer to maximize real estate
-
Pivot structure to flatten data
-
Summary at top for quick insights w/o scrolling to bottom
-
Easily see available balance.
Data visualization allows for a visual view of the high-level components that affect budget availability.
"Before" Engineering draft (FishFood)
"After" UX Exploration
-
We chose 3 CUJs from the original 6 for MVP.
CUJ 1
"As a Financial Planner & Analyst, I need to be able to check my budget availability."

CUJ 3
"As a Cost Center Owner, I need to create a budget placeholder."

CUJ 4
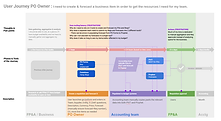
"As a Purchase Order Owner, I need to forecast a budget line item."

Mobile Herald-lite feature
(notification -> budget transfer)
The lightweight mobile feature allows for simple actions and status views.
In this flow, the Financial Planner & Analyst is able to easily initiate a budget transfer request from viable accounts, based on customizable thresholds. Machine learning can be employed in the future to further recommend tailored selections.

- THE OUTCOME
1 To 2 weeks -> 1 to 2 seconds - Time to see budget availability
-
APIs, curating appropriate figures from disparate back-end sources, delivers sumated totals for both budget and operating capital dimensions, to users, allowing them to make immediate and accurate decisions on their division spending and budget planning.
100% Audit Compliance for Legal and Accountability
-
By building in contextual messaging, we removed the chaos factor of spend accounting and approvals. Users are now able to keep all communications about any specific entity, in context and accountable for immediate auditing.
ZERO Mathematical Errors / Data Staleness
-
By automating the process and allowing the user to pivot their data as needed, with sort and filter capabilities, we have removed the archaic, inefficient, practice of copying and pasting into spreadsheets, and re-ingesting those data, which had historically introduced errors.
